High-Level Wrapper Half Violin Plots per Country
sahel_gghalfviolin.RdThis function is a convenience wrapper for the violin plots within the Sahel
ASP plot. If you want a custom plot, check out the geom_flat_violin_l()
and geom_flat_violin_r() functions in this package.
Usage
sahel_gghalfviolin(
  data,
  variable,
  countries,
  orientation = "Vertical-Left",
  alpha_boxplot = 0.5,
  alpha_violin = 0.8,
  width_boxplot = 0.5,
  width_violin = 0.8,
  title = deparse(substitute(variable)),
  subtitle = "Half-Violin Plot",
  caption = NULL,
  xtitle = NULL,
  ytitle = NULL,
  scale = ggplot2::geom_blank(),
  xlim = NULL,
  ylim = NULL,
  add_boxplot = TRUE,
  theme = themeaspdark
)
Arguments
- data
A data frame
- variable
Variable name to plot. Continuous or count.
- countries
Variable name to plot. Continuous or count.
- orientation
Orientation of the graph
- alpha_boxplot
Transparency for the boxplot element.
- alpha_violin
Transparency for the violin element.
- width_boxplot
Width for the boxplot element.
- width_violin
Width for the violin element.
- title
Plot title
- subtitle
Plot subtitle
- caption
Plot caption
- xtitle
Plot x-axis title
- ytitle
Plot y-axis title
- scale
Scaling function from
{ggplot2}- xlim
Define plot limit on x-axis. Supply a vector of bounds,
c(325, 500).- ylim
Define plot limit on y-axis. Supply a vector of bounds,
c(325, 500).- add_boxplot
TRUEby default. Add a boxplot inside the violin plots?- theme
Theme applied
Examples
library(patchwork)

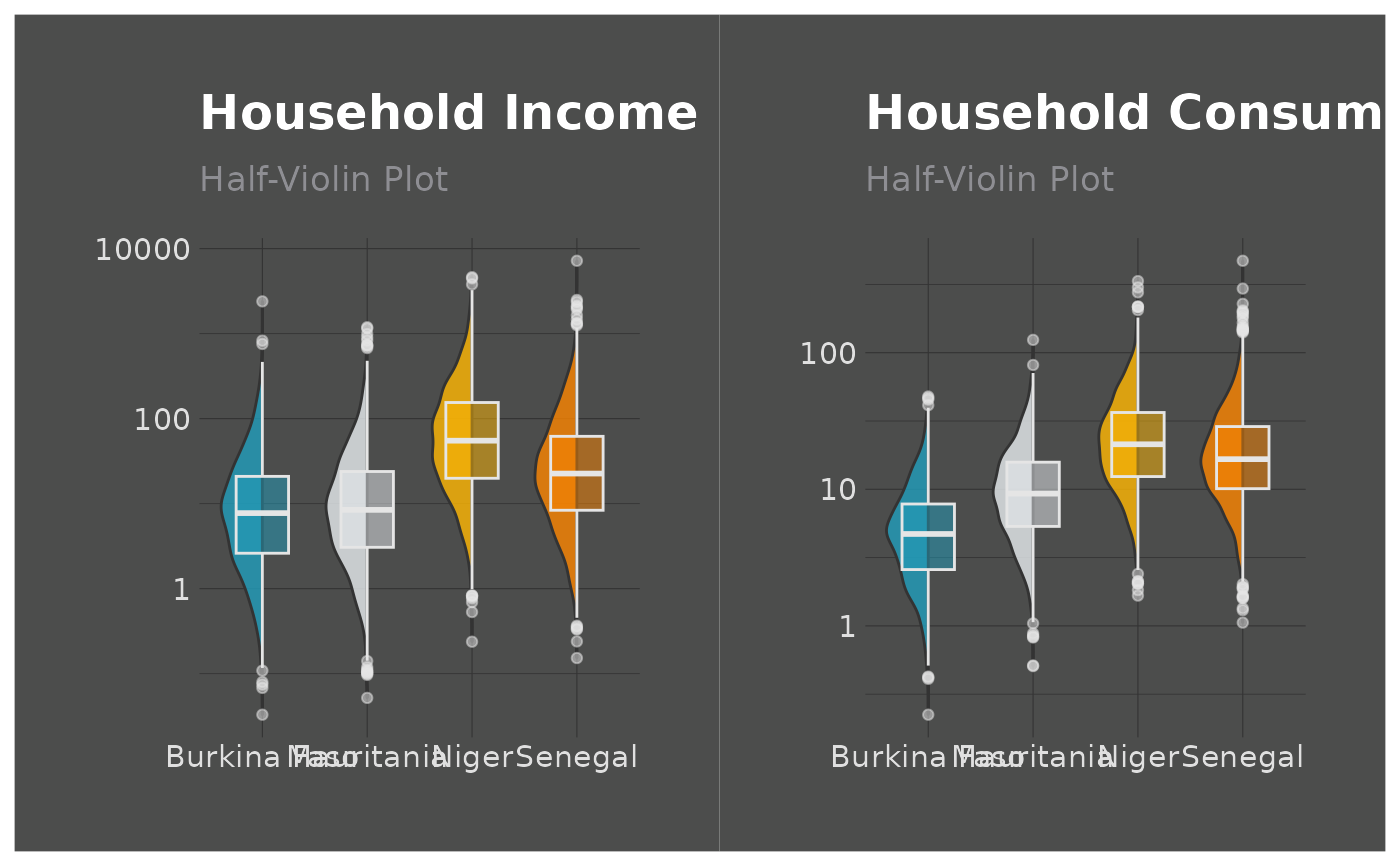
# Vertical Left
sahel_gghalfviolin(
  data = sahel_sim,
  variable = hh_income,
  countries = country_names,
  title = "Household Income",
  scale = ggplot2::scale_y_log10()
) + sahel_gghalfviolin(
  data = sahel_sim,
  variable = hh_consumption,
  countries = country_names,
  title = "Household Consumption",
  scale = ggplot2::scale_y_log10()
)


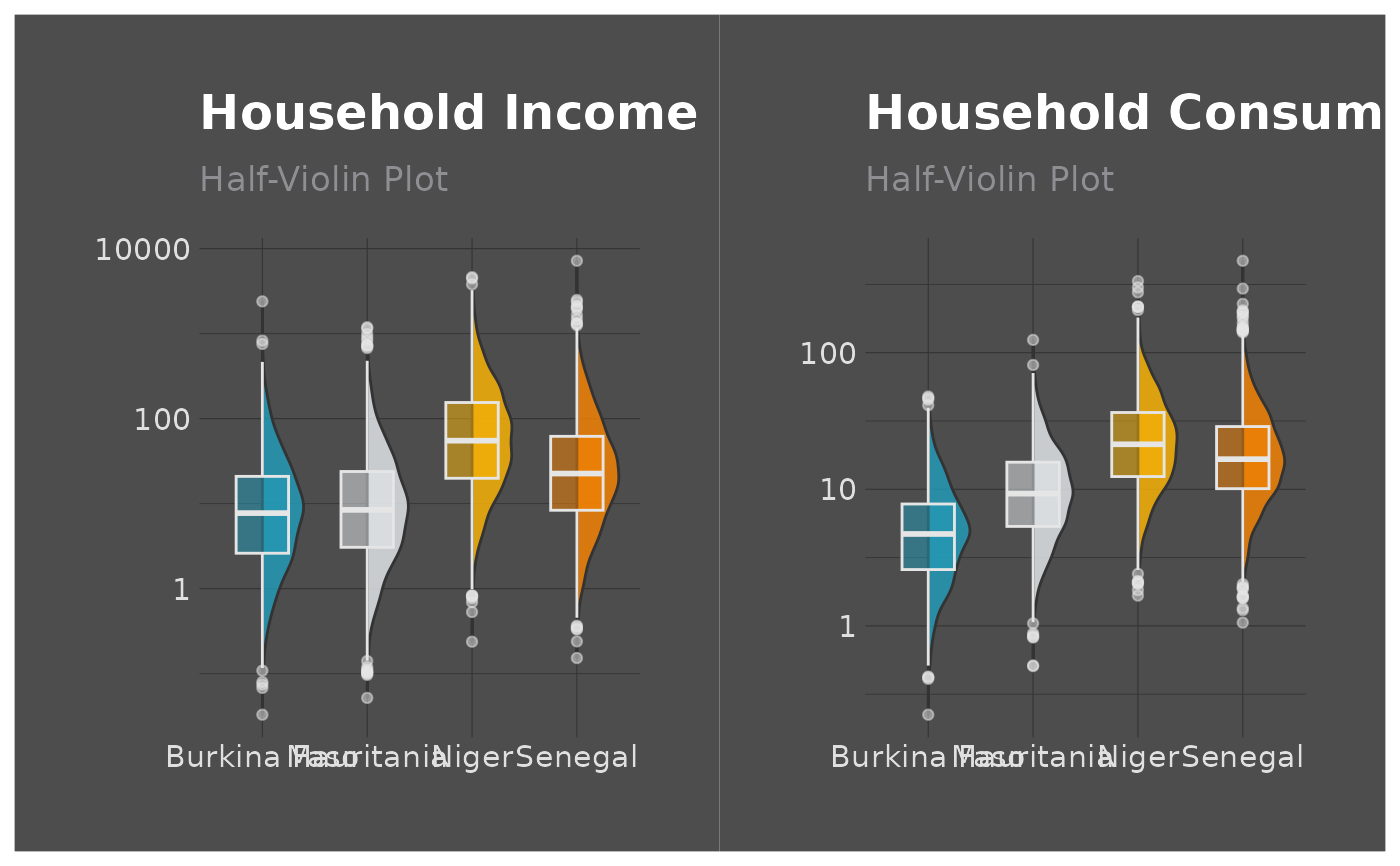
# Vertical Right
sahel_gghalfviolin(
  data = sahel_sim,
  variable = hh_income,
  countries = country_names,
  orientation = "Vertical-Right",
  title = "Household Income",
  scale = ggplot2::scale_y_log10()
) + sahel_gghalfviolin(
  data = sahel_sim,
  variable = hh_consumption,
  countries = country_names,
  orientation = "Vertical-Right",
  title = "Household Consumption",
  scale = ggplot2::scale_y_log10()
)


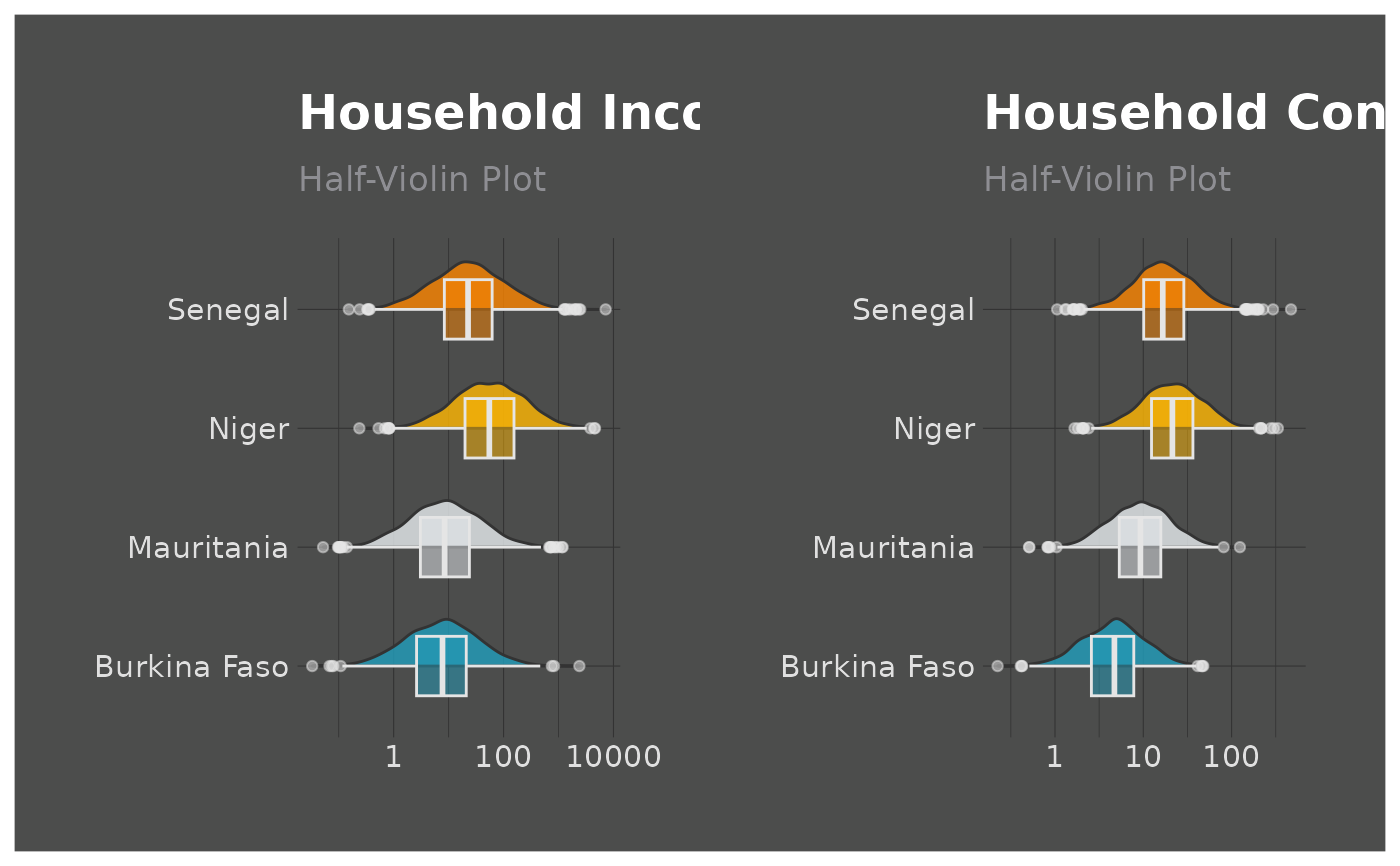
# Horizontal
sahel_gghalfviolin(
  data = sahel_sim,
  variable = hh_income,
  countries = country_names,
  orientation = "Horizontal",
  title = "Household Income",
  scale = ggplot2::scale_y_log10()
) + sahel_gghalfviolin(
  data = sahel_sim,
  variable = hh_consumption,
  countries = country_names,
  orientation = "Horizontal",
  title = "Household Consumption",
  scale = ggplot2::scale_y_log10()
)
