Flat (or half) vertical violin plot geom. Right side.
geom_flat_violin_r.Rdgeom_flat_violin_r() plots half of a violin plot created by
ggplot2::geom_violin(). This function plots a vertical half of
a violin plot. For the horizontal version of the function, check out
geom_flat_violin_h().
Usage
geom_flat_violin_r(
  mapping = NULL,
  data = NULL,
  stat = "ydensity",
  position = "dodge",
  trim = TRUE,
  scale = "area",
  show.legend = NA,
  inherit.aes = TRUE,
  ...
)
Source
Adapted from the following S-O thread.
Arguments
- mapping
Set of aesthetic mappings created by
ggplot2::aes(). If specified andinherit.aes = TRUE(the default), it is combined with the default mapping at the top level of the plot. You must supply mapping if there is no plot mapping.- data
The data to be displayed in this layer. There are three options: If NULL, the default, the data is inherited from the plot data as specified in the call to ggplot(). A data.frame, or other object, will override the plot data. All objects will be fortified to produce a data frame. See fortify() for which variables will be created. A function will be called with a single argument, the plot data. The return value must be a data.frame, and will be used as the layer data. A function can be created from a formula (e.g. ~ head(.x, 10)).
- stat
Use to override the default connection between
geom_violin()andstat_ydensity().- position
Position adjustment, either as a string, or the result of a call to a position adjustment function.
- trim
If
TRUE(default), trim the tails of the violins to the range of the data. IfFALSE, don't trim the tails.- scale
if "area" (default), all violins have the same area (before trimming the tails). If "count", areas are scaled proportionally to the number of observations. If "width", all violins have the same maximum width.
- show.legend
logical. Should this layer be included in the legends?
NA, the default, includes if any aesthetics are mapped.FALSEnever includes, andTRUEalways includes. It can also be a named logical vector to finely select the aesthetics to display.- inherit.aes
Use to override the default connection between
geom_violin()andstat_ydensity().- ...
Other arguments passed on to
layer(). These are often aesthetics, used to set an aesthetic to a fixed value, likecolour = "red"orlinewidth = 3. They may also be parameters to the paired geom/stat.
Examples
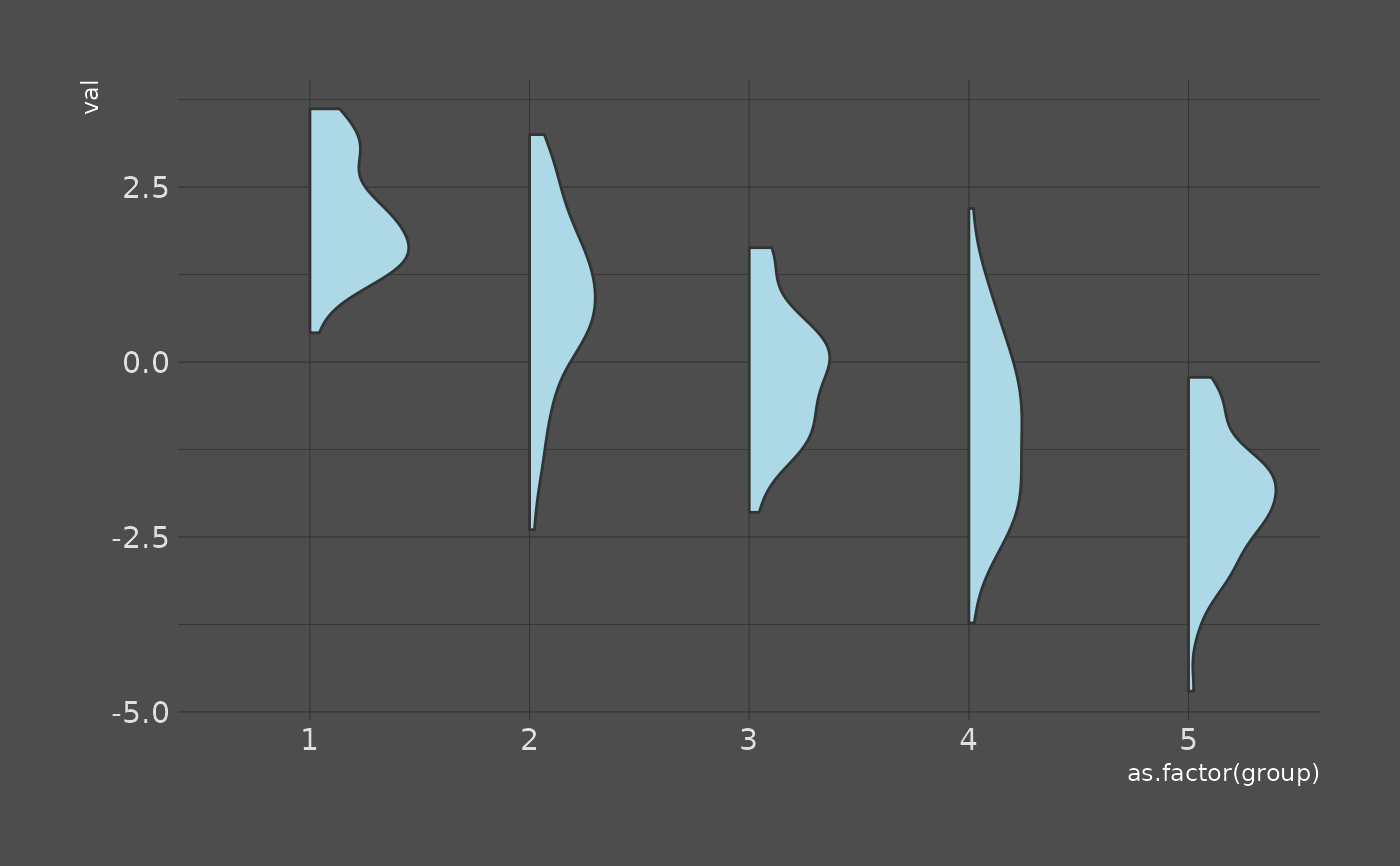
# Right:

df = data.frame(val = c(), group = c())
for(i in 1:5){
  offset = i - 3
  df = rbind(df,
             data.frame(val = rnorm(n = 50, mean = 0 - offset), group = i)
  )
}
ggplot2::ggplot(df, ggplot2::aes(as.factor(group), val)) +
   geom_flat_violin_r(fill = "lightblue") +
   themeaspdark()


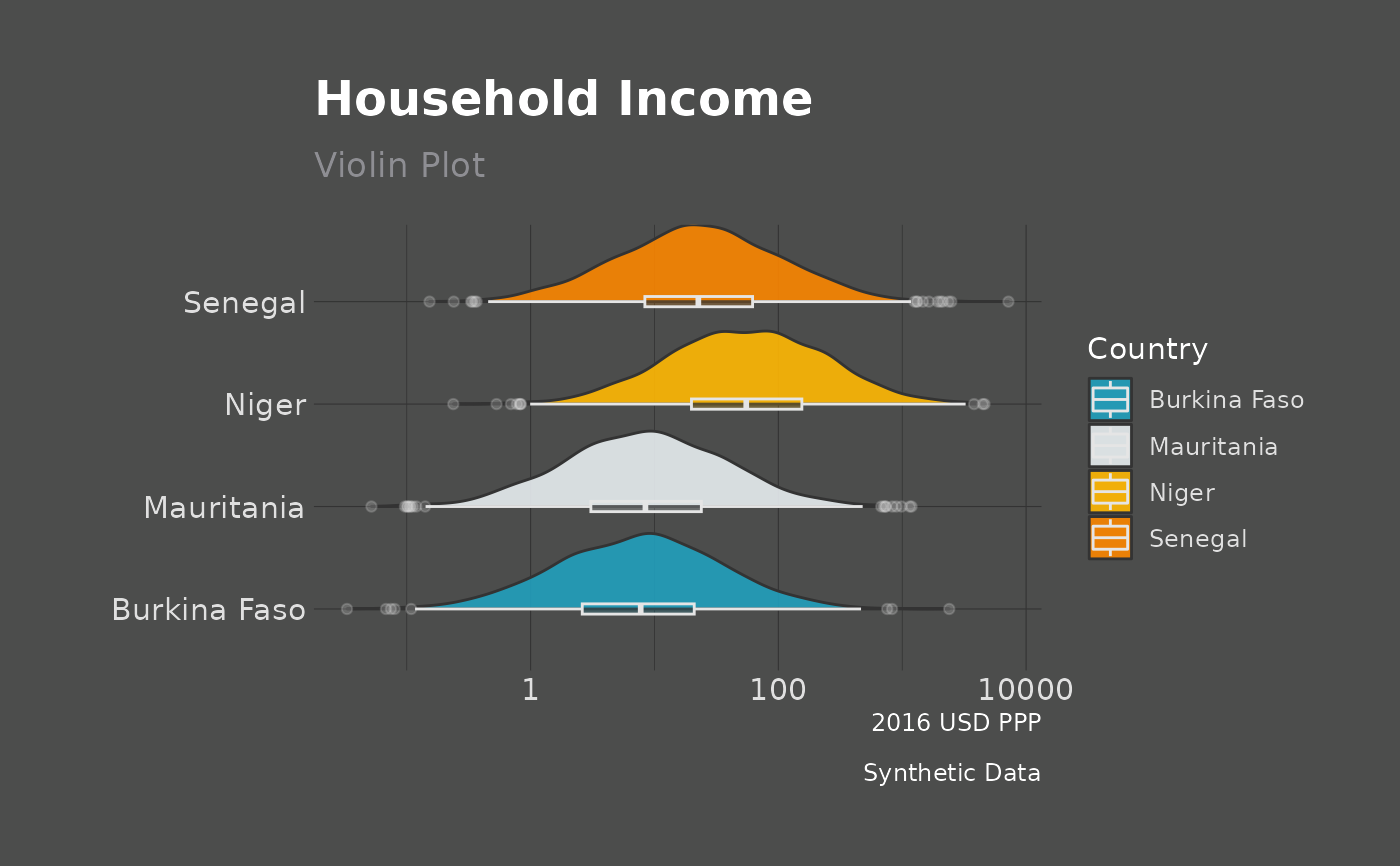
# Single Variable Horizontally with coord_flip():

ggplot2::ggplot(sahel_sim, ggplot2::aes(x = country_names,
                                         y = hh_income,
                                         fill = country_names)) +
  geom_flat_violin_r(alpha = 0.9,
                     position = ggplot2::position_dodge(1),
                     width = 1.5) +
  ggplot2::coord_flip() +
  ggplot2::geom_boxplot(width = 0.1, color = "grey90", alpha = 0.2,
                         position = ggplot2::position_dodge(1)) +
  ggplot2::scale_fill_manual(values = unname(asp_palettes$Countries)) +
  ggplot2::scale_y_log10() +
  ggplot2::labs(title = "Household Income", subtitle = "Violin Plot",
               caption = "Synthetic Data",
               x = "", y = "2016 USD PPP", fill = "Country") +
  SahelGraphR::themeaspdark()


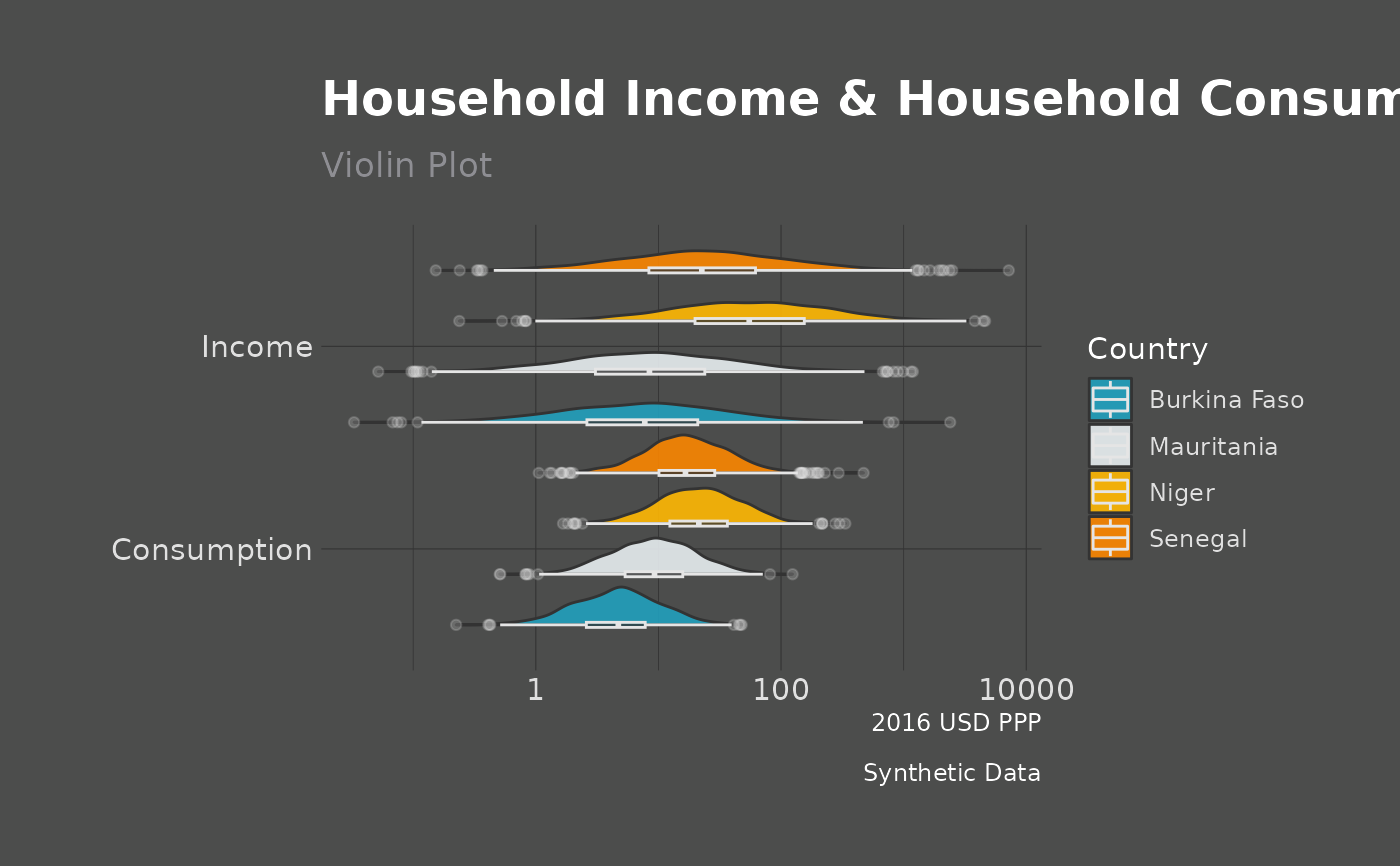
# Multiple Variables Horizontally with coord_flip():

sahel_sim_long_monetary <- tidyr::gather(sahel_sim, key = "variable",
                                         value = "value", hh_income,
                                         hh_consumption)
ggplot2::ggplot(sahel_sim_long_monetary,
                 ggplot2::aes(x = variable,
                               y = value,
                               fill = country_names)) +
  geom_flat_violin_r(alpha = 0.9,
                     position = ggplot2::position_dodge(1),
                     width = 3) +
  ggplot2::coord_flip() +
  ggplot2::geom_boxplot(width = 0.1, color = "grey90", alpha = 0.2,
                         position = ggplot2::position_dodge(1)) +
  ggplot2::scale_fill_manual(values = unname(asp_palettes$Countries)) +
  ggplot2::scale_x_discrete(labels = c("Consumption", "Income")) +
  ggplot2::scale_y_log10() +
  ggplot2::labs(title = "Household Income & Household Consumption",
                 subtitle = "Violin Plot", caption = "Synthetic Data",
       x = "", y = "2016 USD PPP", fill = "Country") +
  SahelGraphR::themeaspdark()
#> Warning: `position_dodge()` requires non-overlapping x intervals
