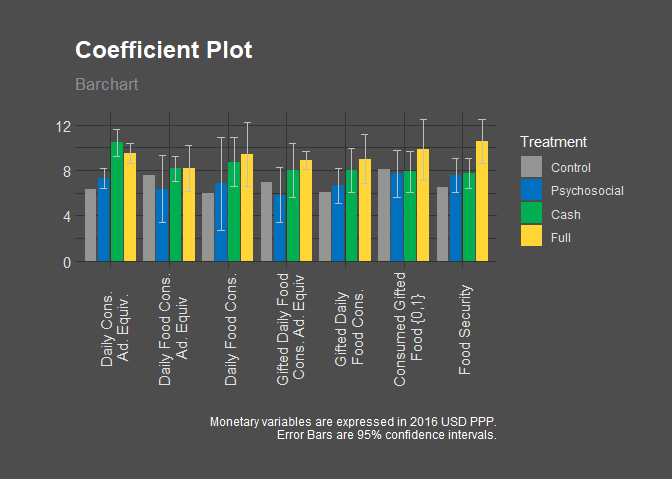
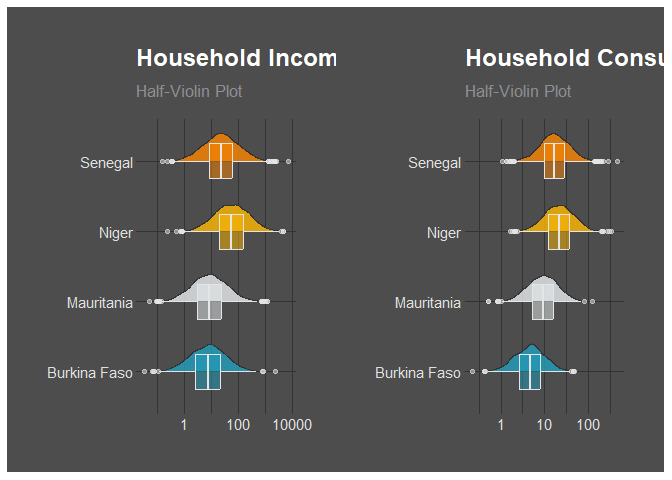
SahelGraphR is a package aimed at providing functions to speed up the production of graphs (and maybe tables in the future?) of the Sahel ASP RCT evaluation by DIME.
Installation
You can install the development version of SahelGraphR from GitHub with:
# install.packages("devtools")
devtools::install_github("BBieri/SahelGraphR")
Graphs
{SahelGraphr} contains functions and wrappers to rapidly produce consistent graphs across the four countries.
Maps
SahelGraphR includes a helper function to download (sub-)national shapefiles from HDX for easy and fast mapmaking in R of the four countries in the RCT.
#> Departement Level Selected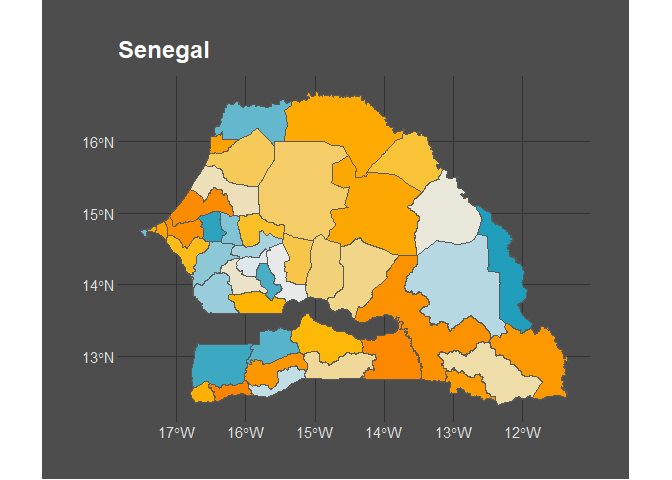
Themes
This package also contains two themes for the production of ggplot2 graphs for the Sahel ASP graphs.
Dark theme:
Here is an example graph using the dark theme:
library(SahelGraphR)
## basic example code
library(ggplot2)
  # Prepare data
cty_mpg <-
  aggregate(mpg$cty, by = list(mpg$manufacturer), FUN = mean)  # aggregate
colnames(cty_mpg) <- c("make", "mileage")  # change column names
cty_mpg <- cty_mpg[order(cty_mpg$mileage),]  # sort
cty_mpg$make <- factor(cty_mpg$make, levels = cty_mpg$make)
# Plot
ggplot(cty_mpg, aes(x = make, y = mileage)) +
  geom_segment(aes(
    x = make,
    xend = make,
    y = 0,
    yend = mileage
  ), color = "white") +
  geom_point(size = 3, color = SahelGraphR::asp_palettes$Dark[["yellow-full"]]) +
  labs(title = "Lollipop Chart",
       subtitle = "Make Vs Avg. Mileage",
       caption = "source: mpg") +
  SahelGraphR::themeaspdark() +
  theme(axis.text.x = element_text(angle = 65, vjust = 0.6))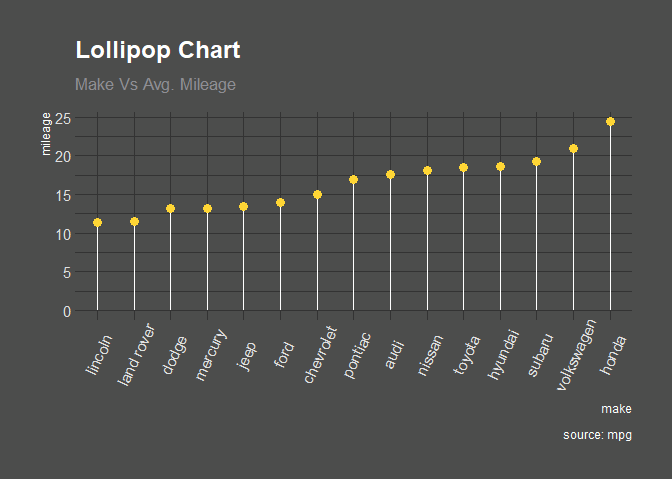
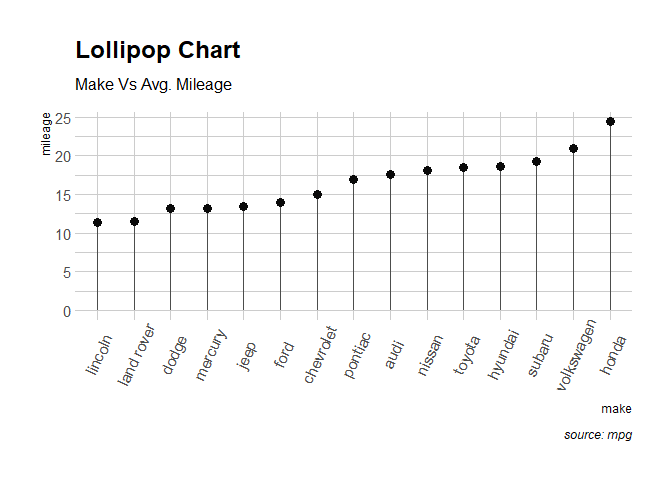
Light theme:
Here is an example graph using the light theme:
library(SahelGraphR)
## basic example code
library(ggplot2)
  # Prepare data
cty_mpg <-
  aggregate(mpg$cty, by = list(mpg$manufacturer), FUN = mean)  # aggregate
colnames(cty_mpg) <- c("make", "mileage")  # change column names
cty_mpg <- cty_mpg[order(cty_mpg$mileage),]  # sort
cty_mpg$make <- factor(cty_mpg$make, levels = cty_mpg$make)
# Plot
ggplot(cty_mpg, aes(x = make, y = mileage)) +
  geom_segment(aes(
    x = make,
    xend = make,
    y = 0,
    yend = mileage
  ), color = "#4c4d4c") +
  geom_point(size = 3, color = SahelGraphR::asp_palettes$Light[["anthracite-full"]]) +
  labs(title = "Lollipop Chart",
       subtitle = "Make Vs Avg. Mileage",
       caption = "source: mpg") +
  SahelGraphR::themeasplight() +
  theme(axis.text.x = element_text(angle = 65, vjust = 0.6))