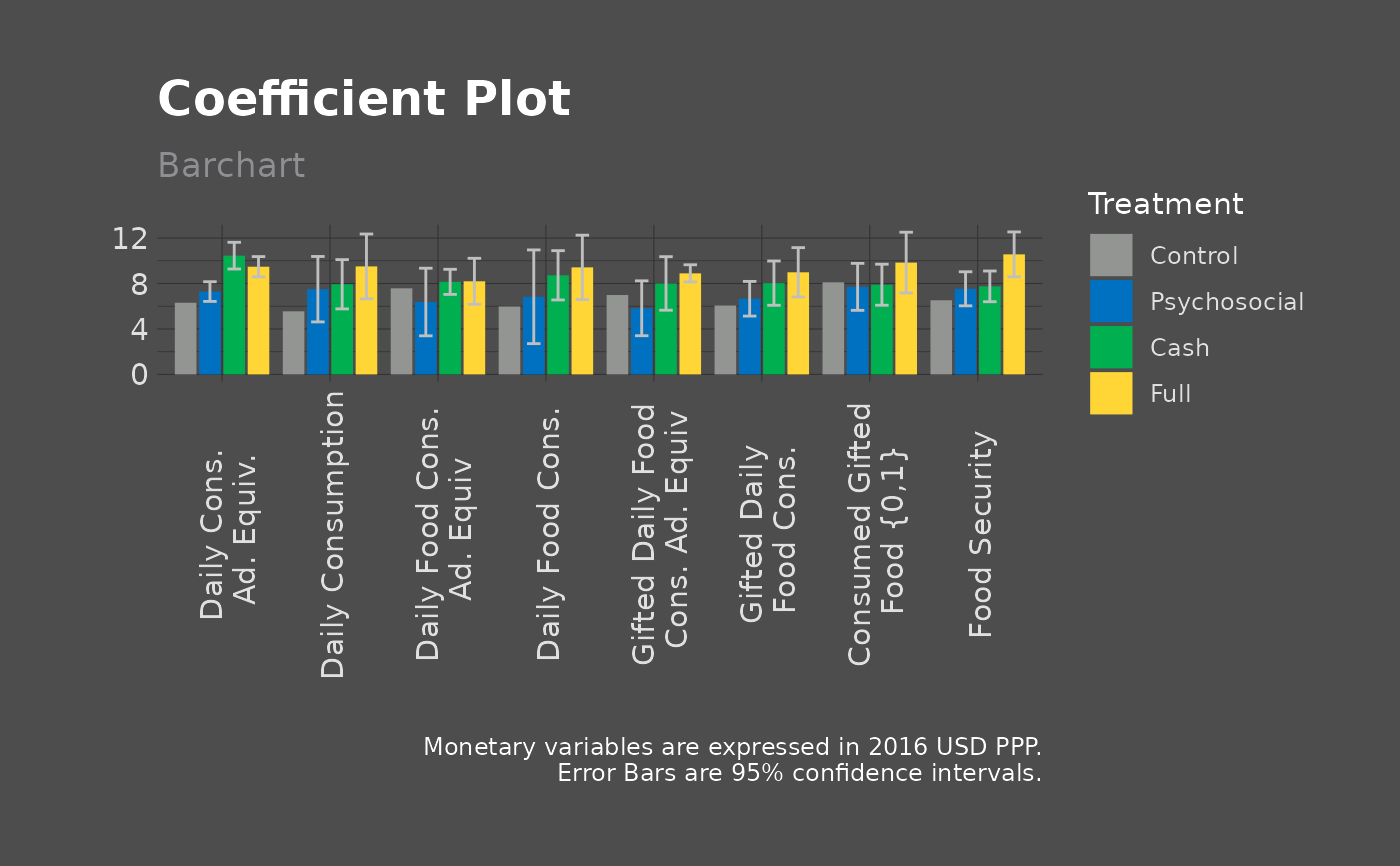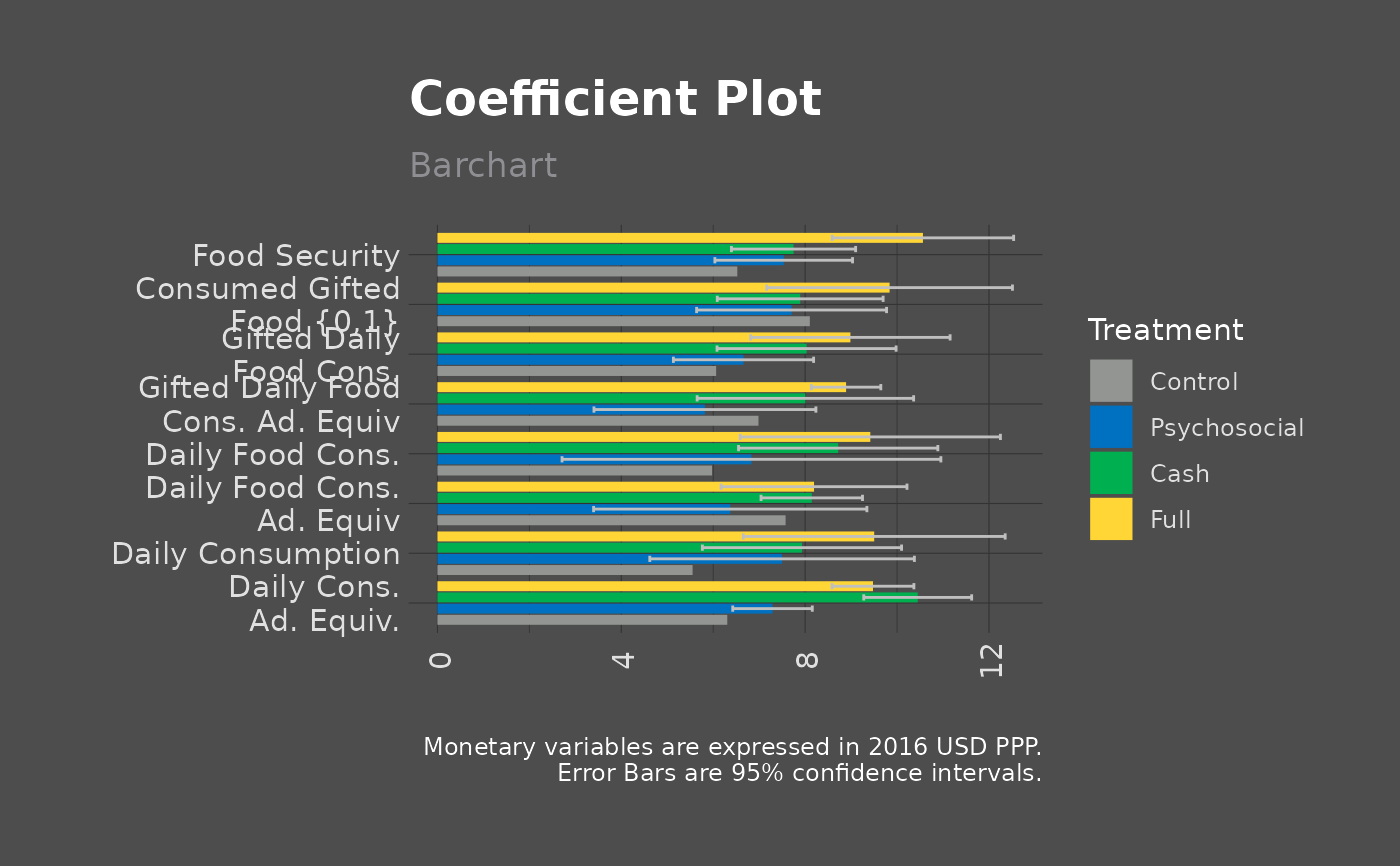
Barplot for Sahel ASP coefficients with sensible defaults
sahel_ggcoefs.RdBarplot for Sahel ASP coefficients with sensible defaults
Usage
sahel_ggcoefs(
  data,
  x = var_name,
  y = Value.y,
  fill = Treatment,
  position = ggplot2::position_dodge(0.9),
  bar_colors = unname(asp_palettes$Dark[2:5]),
  bar_width = 0.8,
  ymin = Value.y - Value.x,
  ymax = Value.y + Value.x,
  errorbar_color = "grey75",
  errorbar_width = 0.5,
  title = "Coefficient Plot",
  subtitle = "Barchart",
  caption =
    "Monetary variables are expressed in 2016 USD PPP.\n                                    Error Bars are 95% confidence intervals.",
  xtitle = "",
  ytitle = "",
  xangle = 90,
  xvjust = 0.6
)
Arguments
- data
A preprocessed dataframe with
sahel_prep_ggcoefs()- x
Variable on the x axis. Should not need to change this if pre-processed.
- y
Variable on the y axis. Should not need to change this if pre-processed.
- fill
Treatment variable for the fill group. Should not need to change this if pre-processed.
- position
ggplot2::position_dodge(0.9)bar and error_bar position.- bar_colors
Colors of the bars corresponding to the treatment arm.
- bar_width
Width of the bars.
- ymin
Computation for the min of the error bar.
- ymax
Computation for the max of the error bar.
- errorbar_color
Color of the error bar.
- errorbar_width
Width of the error bar.
- title
Plot title.
- subtitle
Plot subtitle.
- caption
Plot caption.
- xtitle
X-axis title.
- ytitle
Y-axis title.
- xangle
Label angle of the x-axis label.
- xvjust
Vertical adjustment of the x-axis label.
Examples
# Don't forget to mount the data if using the actual data
# prodregs <-
#  haven::read_dta(r"(U:\fu2_MRT\05_Regstats\fu2_MRT_regstats_hh_prod.dta)")

# Example with simulated data
set.seed(1234)
prodregs <- fabricatr::fabricate(N = 8,
                                 var_name = c("consum_2_day_eq_ppp",
                                               "consum_2_day_ppp",
                                               "food_2_day_eq_ppp",
                                               "food_2_day_ppp",
                                               "food_2_day_g_ppp",
                                               "food_2_day_g_eq_ppp",
                                               "food_2_g_d",
                                               "FIES_rvrs_raw"),
                                 b0 = 0,
                                 b1 = rnorm(N, 0, 1),
                                 b2 = rnorm(N, 0, 1),
                                 b3 = rnorm(N, 0, 1),
                                 avg0 = rnorm(N, 7, 1),
                                 avg1 = rnorm(N, 8, 1),
                                 avg2 = rnorm(N, 9, 1),
                                 avg3 = rnorm(N, 10, 1),
                                 se0 = rnorm(N, 0, 1),
                                 se1 = rnorm(N, 0, 1),
                                 se2 = rnorm(N, 0, 1),
                                 se3 = rnorm(N, 0, 1),
                                 ci95_0 = rnorm(N, 2, 1),
                                 ci95_1 = rnorm(N, 2, 1),
                                 ci95_2 = rnorm(N, 2, 1),
                                 ci95_3 = rnorm(N, 2, 1),
                                 p0 = rnorm(N, 0.8, 0.5),
                                 p1 = rnorm(N, 0.8, 0.5),
                                 p2 = rnorm(N, 0.8, 0.5),
                                 p3 = rnorm(N, 0.8, 0.5),
                                 mht_family = 1) |>
  dplyr::select(-ID)

 # Vertical
 sahel_ggcoefs(sahel_prep_ggcoefs(prodregs))

 # Horizontal
 sahel_ggcoefs(sahel_prep_ggcoefs(prodregs)) + ggplot2::coord_flip()
