A ggplot2 theme for OECD style plots. Adapted from Hrbrmstr's ipsum theme.
Source:R/OECD_theme.R
theme_oecd_dark.RdA ggplot2 theme for OECD style plots. Adapted from Hrbrmstr's ipsum theme.
theme_oecd_dark(
  base_family = "sans",
  base_size = 11.5,
  main_col = "#EBBB67",
  plot_title_family = base_family,
  plot_title_size = 18,
  plot_title_face = "bold",
  plot_title_margin = 10,
  subtitle_family = "sans",
  subtitle_size = 13,
  subtitle_face = "plain",
  subtitle_margin = 15,
  subtitle_col = "gray85",
  strip_text_family = base_family,
  strip_text_size = 12,
  strip_text_face = "plain",
  caption_family = "sans",
  caption_size = 9,
  caption_face = "plain",
  caption_margin = 10,
  axis_text_size = base_size,
  axis_title_family = base_family,
  axis_title_size = 9,
  axis_title_face = "plain",
  axis_title_just = "rt",
  plot_margin = margin(30, 30, 30, 30),
  grid = TRUE,
  axis = FALSE,
  ticks = FALSE
)
Arguments
| base_family, base_size | base font family and size |
|---|---|
| main_col | main color of the plot. Colors points, histogram bars, etc. |
| plot_title_family, plot_title_face, plot_title_size, plot_title_margin | plot title family, face, size and margi |
| subtitle_family, subtitle_face, subtitle_size, subtitle_col | plot subtitle family, face, size, and color |
| subtitle_margin | plot subtitle margin bottom (single numeric value) |
| strip_text_family, strip_text_face, strip_text_size | facet label font family, face and size |
| caption_family, caption_face, caption_size, caption_margin | plot caption family, face, size and margin |
| axis_text_size | font size of axis text |
| axis_title_family, axis_title_face, axis_title_size | axis title font family, face and size |
| axis_title_just | axis title font justification, one of |
| plot_margin | plot margin (specify with |
| grid | panel grid ( |
| axis | add x or y axes? |
| ticks | ticks if |
Value
Themes the current ggplot to current IHEID guidelines.
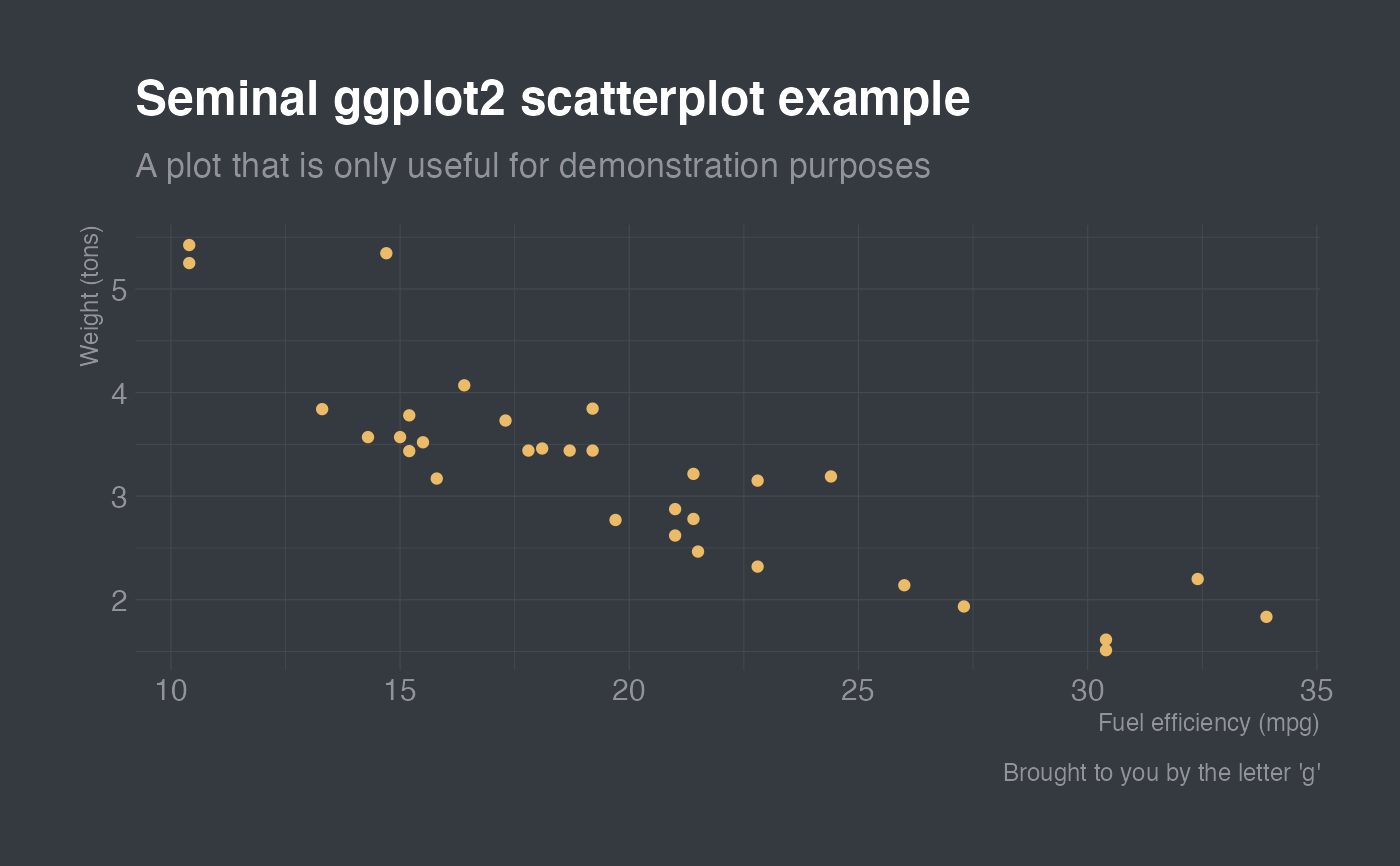
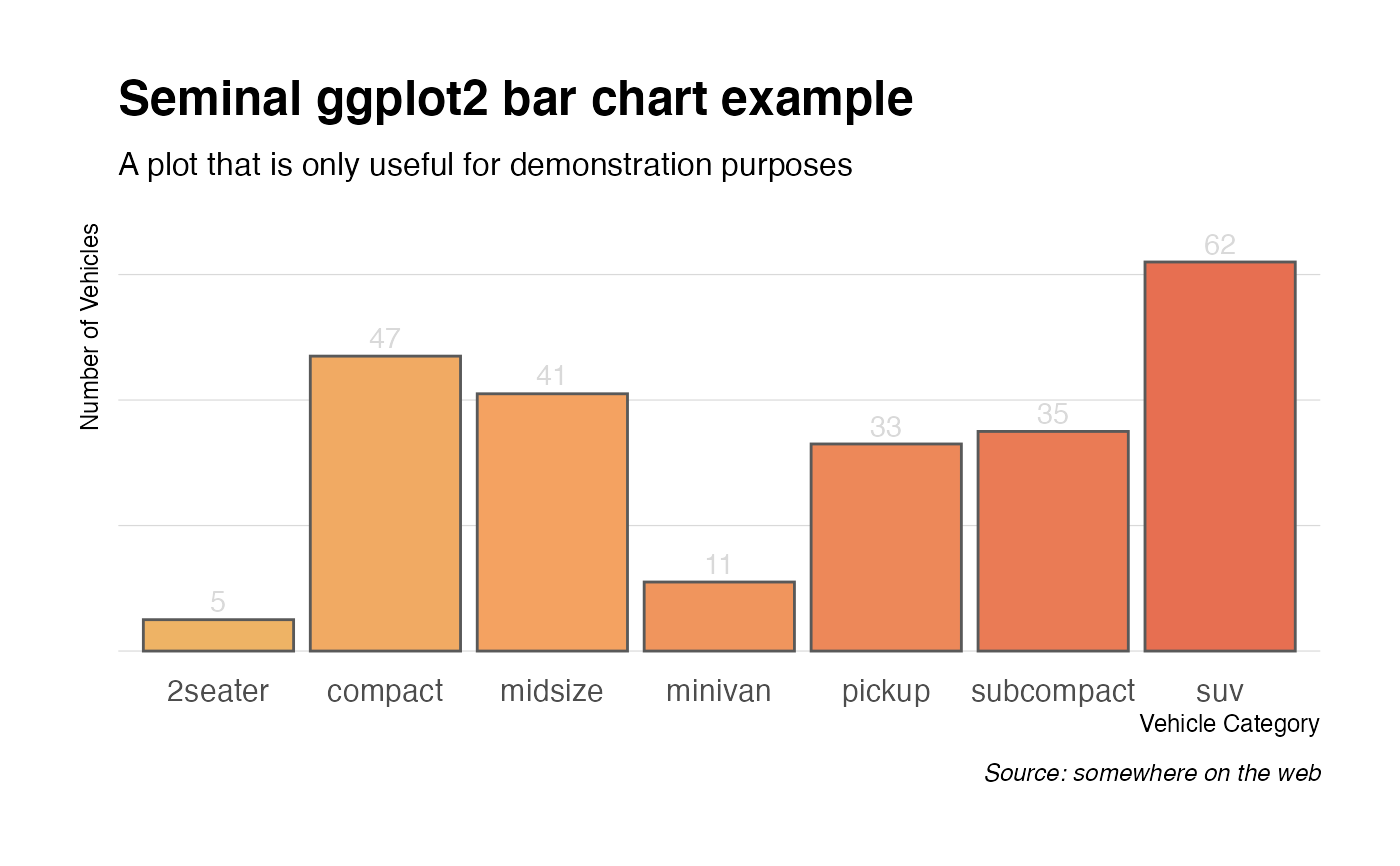
Examples
library(ggplot2) library(dplyr) # Seminal scatterplot ggplot(mtcars, aes(mpg, wt)) + geom_point() + labs(x="Fuel efficiency (mpg)", y="Weight (tons)", title="Seminal ggplot2 scatterplot example", subtitle="A plot that is only useful for demonstration purposes", caption="Brought to you by the letter 'g'") + theme_oecd_dark()# Seminal bar chart count(mpg, class) %>% ggplot(aes(class, n)) + geom_col(fill = oecd_palette("oecd", 21, type = "continuous")[15:21]) + geom_text(aes(label=n), nudge_y=3) + labs(x="Vehicle Category", y="Number of Vehicles", title="Seminal ggplot2 bar chart example", subtitle="A plot that is only useful for demonstration purposes", caption="Source: somewhere on the web") + theme_oecd(grid="Y") + theme(axis.text.y=element_blank())