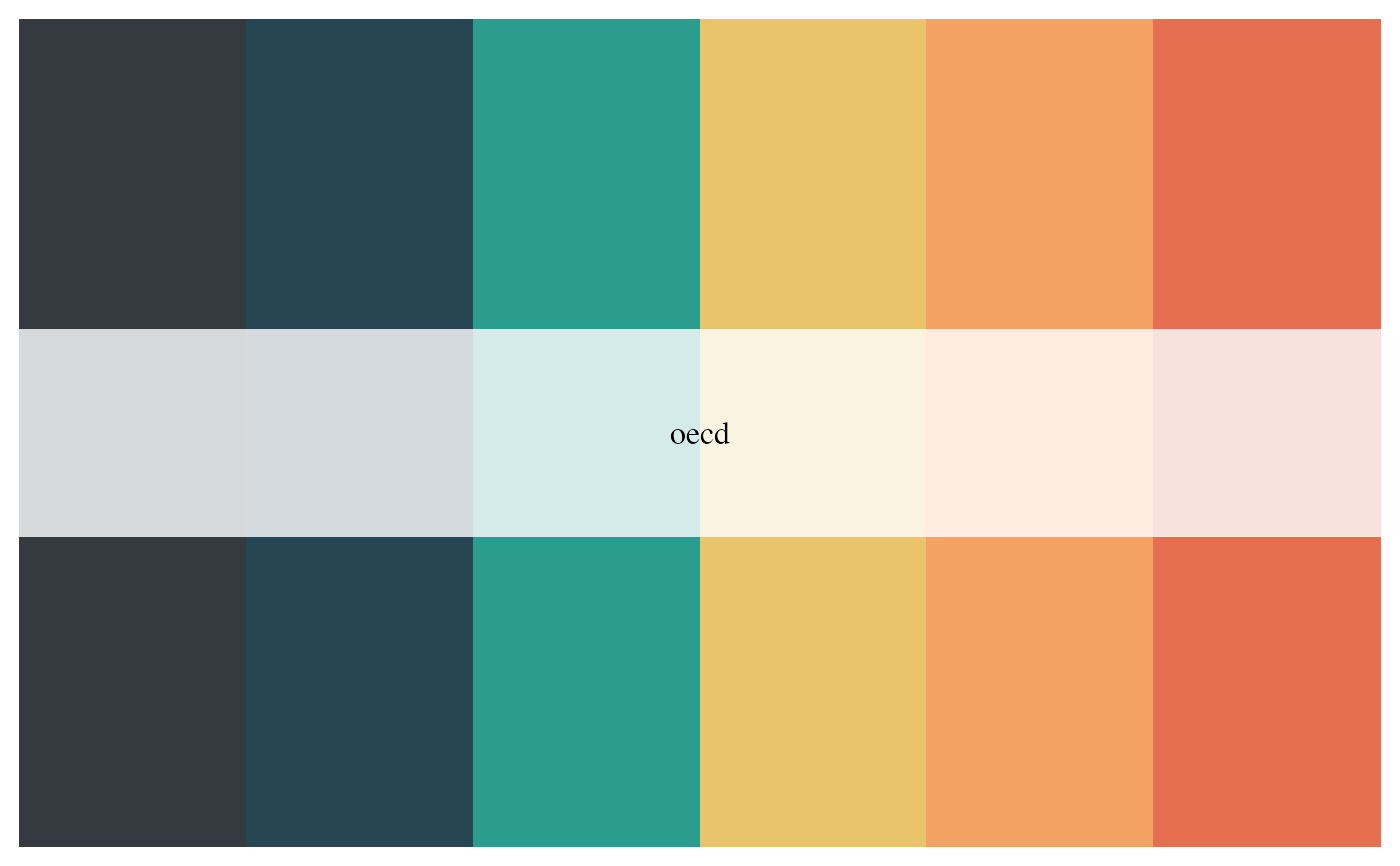
This is a small palette generator for OECD graphs that generates color vectors to be used in graphs
oecd_palette(name, n, type = c("discrete", "continuous"))
Arguments
| name | Name of desired palette. Current choice is:
|
|---|---|
| n | Number of colors desired. If omitted, uses all colours. |
| type | Either "continuous" or "discrete". Use continuous if you want to automatically interpolate between colours. |
Source
Adapted from https://github.com/karthik/wesanderson/blob/master/R/colors.R
Value
A vector of colours.
Examples
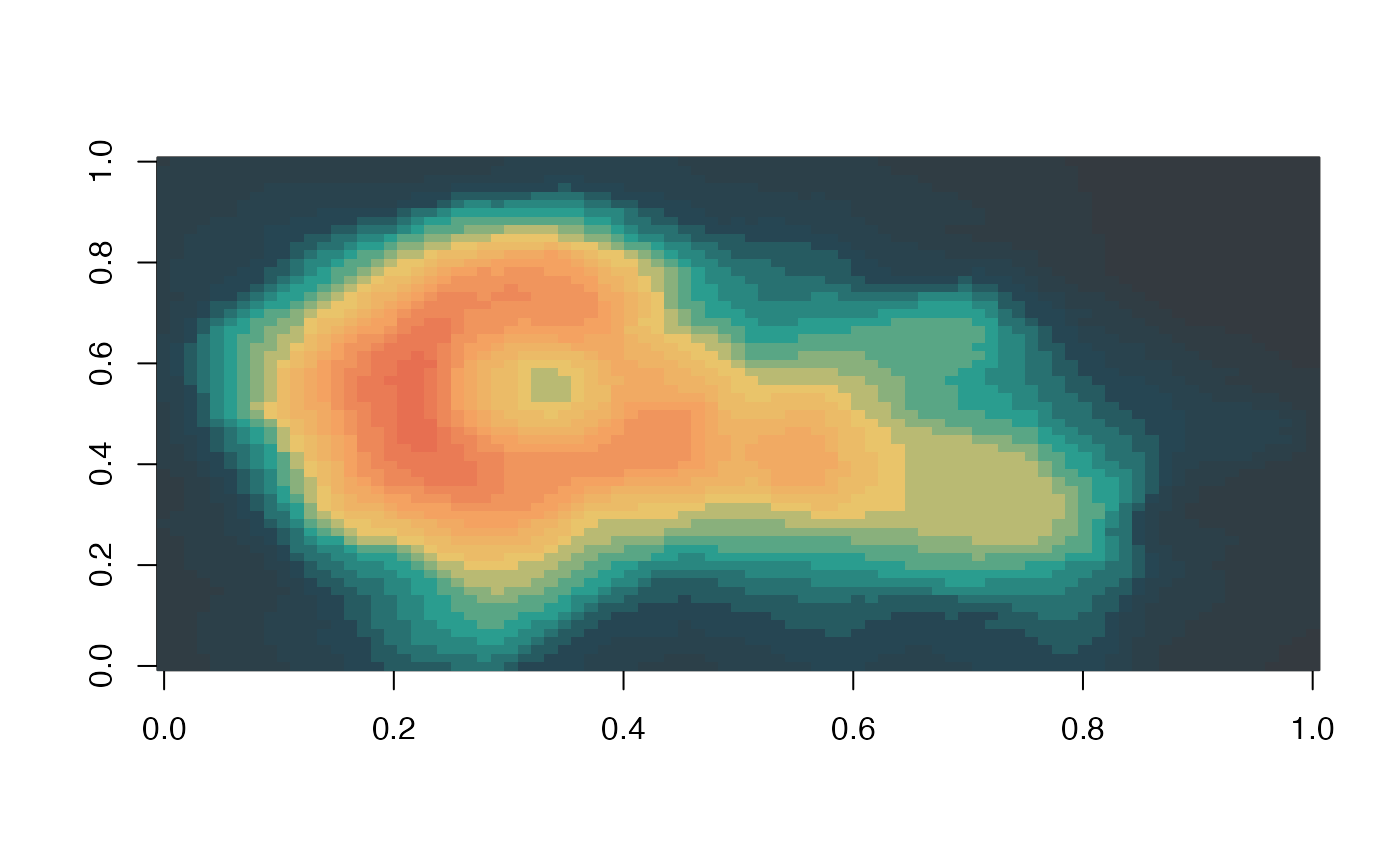
oecd_palette("oecd")# If you need more colours than normally found in a palette, you # can use a continuous palette to interpolate between existing # colours pal <- oecd_palette(21, name = "oecd", type = "continuous") image(volcano, col = pal)