Bernie's theme for ggplot 2 blog graphs. Inspired by the excellent
{hrbrthemes} package.
themebernie.RdBernie's theme for ggplot 2 blog graphs. Inspired by the excellent
{hrbrthemes} package.
Examples
# \donttest{
library(ggplot2)
# Prepare data
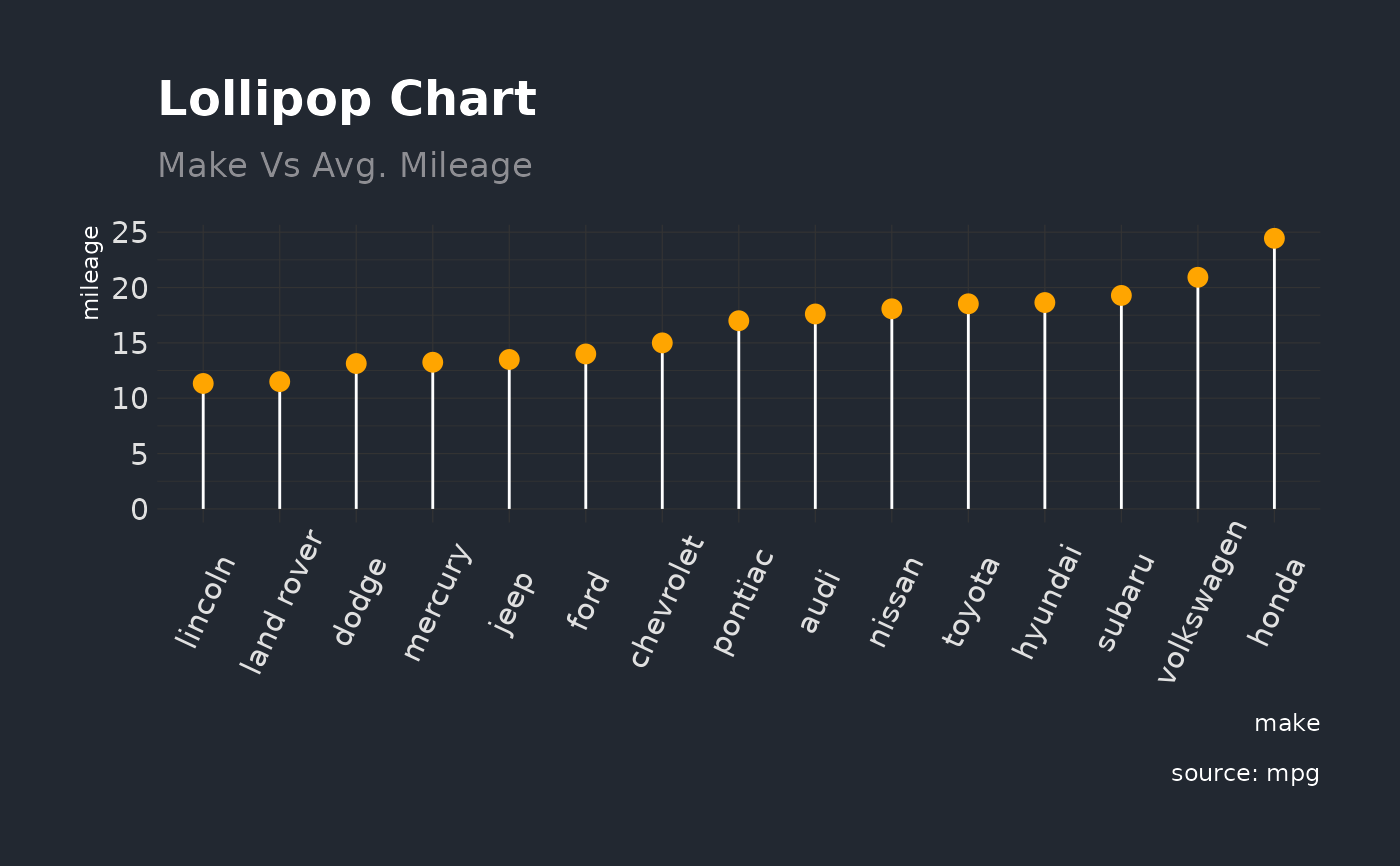
cty_mpg <- aggregate(mpg$cty, by=list(mpg$manufacturer), FUN=mean) # aggregate
colnames(cty_mpg) <- c("make", "mileage") # change column names
cty_mpg <- cty_mpg[order(cty_mpg$mileage), ] # sort
cty_mpg$make <- factor(cty_mpg$make, levels = cty_mpg$make)
# Plot
ggplot(cty_mpg, aes(x=make, y=mileage)) +
geom_segment(aes(x=make,
xend=make,
y=0,
yend=mileage), color = "white") +
geom_point(size=3, color = "orange") +
labs(title="Lollipop Chart",
subtitle="Make Vs Avg. Mileage",
caption="source: mpg") +
HohgantR::themebernie() +
theme(axis.text.x = element_text(angle=65, vjust=0.6))
 # }
# }